R is a cross platform statistical package which is becoming extremely widely used. It is modular and so there are all sorts of add ins available, including a number of sophisticated tools for spatial analysis some of which run considerably faster than Arc / MapInfo. Organisations are also starting to move to this for spatial analysis as its cheaper but more relevantly doesn’t suffer from the endless version changes that ArcGIS is particular forces on people.
R is generally used for a wide range of statistics – but also has the option to generate publication quality graphs (pdfs or images)
Getting started
R can be downloaded here: http://www.r-project.org/
Its also suggested (on Windows) to use r studio - http://www.rstudio.com/ which gives a more friendly IDE
R is a scripted tool – so it can be a steep learning curve but there are endless examples on the web to help get started.
Spatial example using OGR
This syntax is a little obscure – but potentially of considerable use for a wide range of spatial data. Reading from shapefiles (or any other OGR supported datasource is easy / possible)
Read data from SQL server
#download and load rgdal libraries
install.packages("rgdal")
library(rgdal)
#Use ogrinfo to get information about a shape file called stations
ogrInfo("C:/ToFile/RNLI/data", "Stations")
#List the spatial layers available in a SQL server database
#Note you must have the standard OGR tables geometry_columns and spatial_ref_sys present and populated in your database
#Some people say you need a DSN as well – not sure you do …
ogrListLayers("MSSQL:server=SQL2008;database=CMSI-NE;trusted_connection=yes")
#Read a table of polygon objects into a new sitesPoly object
#Then plot them on a map
#N.B. You can’t have binary data in your table – so if you do create a view or somesuch
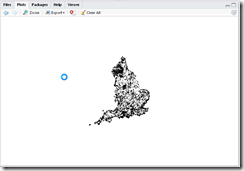
sitesPoly <- readOGR(dsn='MSSQL:server=SQL2008;database=CMSI-NE;trusted_connection=true', layer='SitesGeom')
plot(sitesPoly)

#Select just one record from the layer
oneSite = subset(sitesPoly, sitesPoly$MI_PRINX == 420)
#Make sure the layer is assigned the correct projection
proj4string(oneSite) = CRS("+init=epsg:27700")
#Transform the layer to another projection
oneSite_latlong = spTransform(oneSite, CRS("+init=epsg:4326"))
#Load another library which contains some world boundaries
#Load up coast and countries outlines
library(rworldmap)
data(coastsCoarse)
data(countriesLow)
#plot countries outline limiting extent to Europe
plot(countriesLow, xlim = c(-10, 10), ylim = c(45, 60), legend = F)
#Add sites onto existing map setting colours
proj4string(sitesPoly_ll) = CRS("+init=epsg:27700")
sitesPoly_ll = spTransform(sitesPoly, CRS("+init=epsg:4326"))
plot(sitesPoly_ll, col = "red", border="red", Add=T)
Use a different library to do some plotting
install.packages("maps")
install.packages("mapdata")
library(maps)
library(mapsdata)
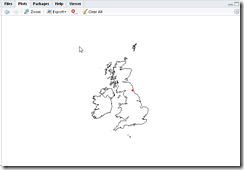
#Select polygons making up UK and plot
#Then plot a point on top
map('worldHires',
c('UK', 'Ireland', 'Isle of Man','Isle of Wight','Wales:Anglesey'),
xlim=c(-11,3), ylim=c(49,60.9))
points(-1.615672,54.977768,col=2,pch=18)
