Lidar processing and analysis
Many organisations can now obtain free lidar (sometimes called LIDAR or LiDAR) data for use in MapInfo, ArcGIS or QGIS.
Lidar data is supplied processed into cells, with each cell having a position and height. This allows the altitude of any location to be accurately determined. But, in order to fully benefit from lidar it is necessary to process the data into a range of analytical GIS layers. By processing the data it is possible to:
- more easily interpret the landscape
- highlight features on the ground
- create new datasets that can be interrogated, such as the steepness or direction of a slope
- model flood risk and hydrology
- determine the best locations for wind farms
- analyse what can be seen from a particular location
We provide a range of spatial outputs derived from lidar that have a range of applications in fields such as archaeology and ecology. Examples of some of our standard outputs are shown below, but we can also undertake processing and analysis to meet specific requirements.
 © Environment Agency copyright 2013. All rights reserved.
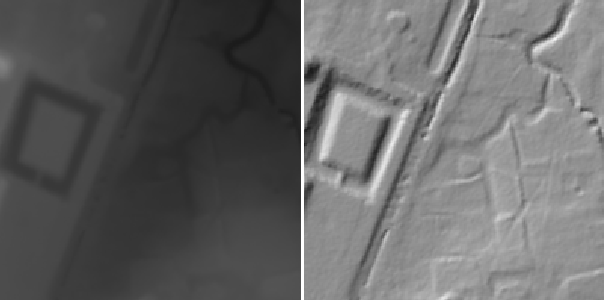
Shaded relief maps are created by modelling the shadow cast by the sun at a set altitude and azimuth (the direction of the sun). By positioning the sun low on the horizon small features that are not visible on the original lidar become much clearer. This is particularly useful for archaeologists searching for anthropogenic features.
One feature of shaded relief modelling is the ability to position the sun anywhere in the virtual sky. In this example the sun is set at 15° above the horizon and 315° east of north (i.e. to the north west), giving a pattern of shading that would never be observed in reality in the UK. We can prepare the images using whatever azimuths you choose, and maximum detail is revealed by processing two sets with the azimuths at 90° to each other.
 © Environment Agency copyright 2013. All rights reserved.
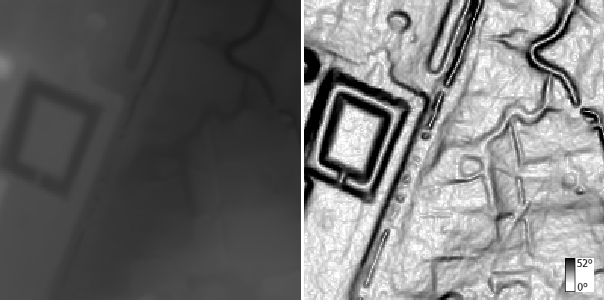
Slope modelling is a way of displaying the variation in slope over an area, with the results expressed between 0° (i.e. horizontal) and 90° (i.e. vertical). The data can also be interrogated to give precise slope information about a particular location. The steepness of a slope will affect habitat and human use, so slope has applications in both archaeology and ecology.
 © Environment Agency copyright 2013. All rights reserved.
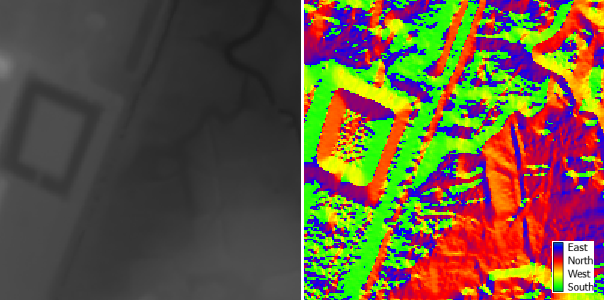
Aspect mapping is a way of displaying the direction a slope faces. It does not take the steepness of the slope into account, but can be combined with slope modelling to filter out only those areas steep enough for aspect to be relevant. The data can be interrogated to give a precise aspect for a particular location. Aspects can also be filtered to provide a more targeted model (e.g. showing south-facing slopes only), which avoids the garish colouring shown.
Aspect modelling is particularly relevant to ecological studies, as the direction of the slope will affect both habitat type and the species that an area can support.
 © Environment Agency copyright 2013. All rights reserved.
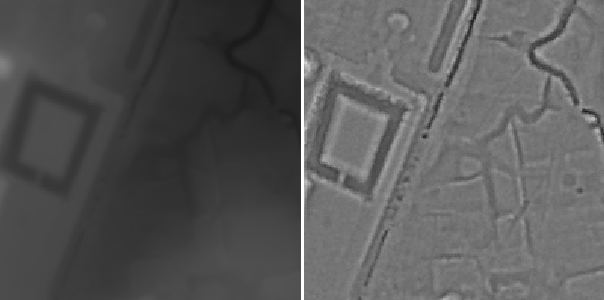
Local Relief Modelling (LRM) aims to strip out all variation in height due to macro-topography, such as mountains and hills, leaving only the micro-topography, such as banks and ditches. This is particularly useful in very hilly areas, as it can highlight micro-topographical features within areas where shaded relief modelling is ineffective.
As with shaded relief modelling, this is particularly useful for archaeologists searching for anthropogenic features. It also has an additional useful advantage over shaded relief modelling: additional processing ensures that the data can be interrogated in order to determine the height of a feature relative to the surrounding macro-topography.
The lidar data shown here is available from Defra Survey Open Data.